
Have you ever wondered how good your TrackMan Combine test score really was?
It’s easy to look at the top of the leaderboard and see Daniel Gavins score of 93 and think fantastic score, and scrolling down you see the top 23 players have broken that elusive 90.0 barrier.
But what does that mean, how good actually is 93, 90 or 80 for that matter? I hope to answer that question below using Mark Broadie’s Strokes Gained and give a better understanding to how good a score in the 90’s really is, and more than that, all the results and scores we are so used to seeing.
I think the TrackMan Combine test is an invaluable tool which is relevant to players of all abilities. As a practice tool I can think of no better way that replicates the pressure you feel on the course when you glance over to the little blue bar running across the bottom of the screen and see you are beating a personal best score. As a coach I use the combine test as often as I can.
Strokes Gained is a breath of fresh air in the world of golf statistics. It’s a concept created by Mark Broadie and is explained in his book “Every Shot Counts” in my opinion is a must read for any golfer interested in statistics be it coaches looking to help their players, players themselves interested in personal development or the weekend golfer just looking to improve.
I applaud Mark Broadie for making such an easy to understand new form of stats and this paper would not have been possible without Every Shot Counts. Mark Broadie analysed millions of shots over an 8 year period using ShotLink data and was able to come up with a baseline for average shots to hole out from every distance and lie. What that means is he has an exact figure for the average shots it will take if you are 160yds in the fairway, (2.98 shots) 100yds in the rough (3.02 shots) 40 yds in the sand (2.82 shots), this also applies to shots on the green.
Mark calculated that from 8ft the average number of shots needed to hole out is 1.5, so if a PGA Tour Pro hit 2 putts from 8ft he will averagely two putt one and one putt the other, giving the shots to hole out as 1.5. An average of one two putt and one one putt. From 20ft it takes 1.87 shots, from 4ft it’s 1.13 shots and so on and so on. Every length of shot, every lie available he has a worked out, a remarkable feat of statistical analysis.
Applying this Information to TrackMan Combine (“TC”)
Strokes Gained (“SG”) can be applied to the TC very easily. To work out the SG score of a shot all you need is 3 pieces of information from said shot:
- The starting distance from the hole
- The lie of the ball (for the sake of the TC I have presumed shots are played from fairway conditions*)
- The finishing length from the hole.
The first data point is easily collected as the length of each shot is dictated by the TC. The second data point, the lie of the ball, we can presume that fairway conditions are present as the majority of ranges around the world have hitting areas that are either grass bays cut to fairway length or matts which resemble fairway lies. The final data point is also given to us by TrackMan as you get “distance to hole” on screen, in feet, after every shot you hit.
* There may be some range’s in the world where they play from rough length grass or sand, however the number of combine tests played from normal ranges where the grass is cut to fairway length will greatly outweigh the rough length ranges.
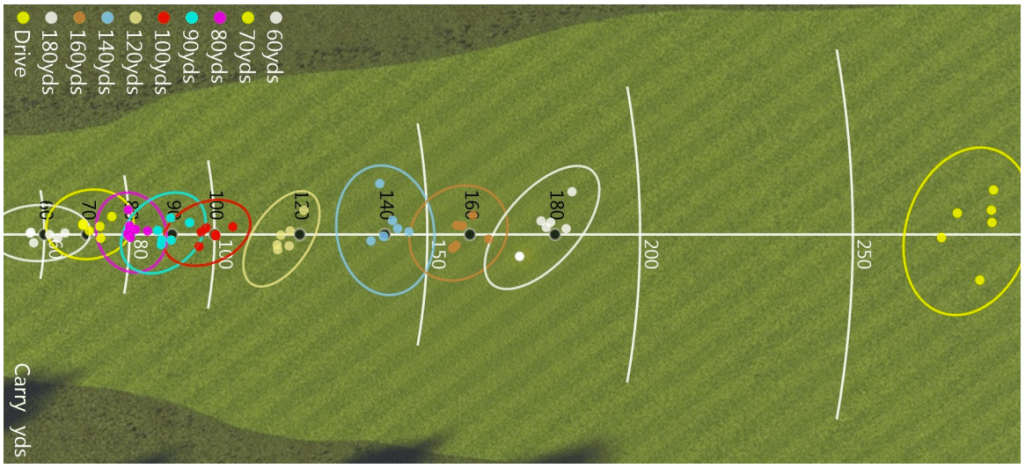
So thats great to know but how will it help to evaluate the results the Combine gives us. I have used the information from a past test that Edoardo Molinari completed and very kindly posted online (if you search TC into google it can be found in the images very easily). Below is an example of how SG can be used to give further analysis.
Shot 1 – 60yds hit to 10ft from hole
- From 60 yards we know it should take Edoardo 2.7 shots to finish the hole.
- We know he hit it to 10ft from the hole.
- We know from 10 feet on the green it takes 1.61 shots to finish the hole.
We get the SG figure from the information above, Edoardo started off with figure of 2.7 shots to hole out, after taking the shot his ball finished 10ft from the pin. 10ft on the green has an average of 1.61 to hole out. We start by looking at the difference between these two figures, which is 1.09. Then we subtract 1 to allow for the shot it took him to get it to 10ft and this leaves us with the final SG figure, in this case +0.09.
| 2.7Start Position | – | 1.6Left to hole | – | 1Shot Taken | = | +0.09Strokes Gained |
Because the end figure was positive it means he hit a better than average shot. SG means that for that shot Edoardo was better than the PGA tour average from 60yds by 0.09 shots.
Lets see what happens when we apply this to another shot from the same yardage.
Shot 5 – 60yds hit to 15ft from hole
So he started from the same distance and lie from the hole so 2.7 shots to hole out remains the same. This time he hit the ball to 15ft from the hole, from there it takes 1.78 shots on average to hole out. Then we take off the stroke that Edoardo actually took to hit it to 15ft and we get left with a SG of -0.08 for that shot.
| 2.7Start Position | – | 1.78Left to hole | – | 1Shot Taken | = | -0.08Strokes Gained |
Here we can see that Edoardo was worse than average with this shot, by -0.08 of a shot. This is represented by a negative figure.
This same formula can be applied to every shot in the test except for driver (driver will be explained later). As you go up through the yardages the starting number increases as a shot from 60 yds will take less shots on average than a shot from 100 yards, and a shot from 100 yds less than 180 yards. See Table 1 for a list of the yardages given in the TC and their average shots to hole out.
Table 1
| Yardage | 60 Yds | 70 Yds | 80 Yds | 90 Yds | 100 Yds | 120 Yds | 140 Yds | 160 Yds | 180 Yds |
| Shots to hole out ave. | 2.70 | 2.73 | 2.75 | 2.78 | 2.80 | 2.85 | 2.91 | 2.98 | 3.08 |
Edoardo’s Test with Strokes Gained
Using this simple formula we can really see how good Edoardo’s play was from 60 and 70 yards.
Table 2
| 60 Yds | SG Start | Hit To | SG To Hole Out | Strokes Gained Score |
| 1 | 2.70 | 10ft | 1.61 | +0.09 |
| 2 | 2.70 | 4ft | 1.13 | +0.57 |
| 3 | 2.70 | 10ft | 1.61 | +0.09 |
| 4 | 2.70 | 10ft | 1.61 | +0.09 |
| 5 | 2.70 | 15ft | 1.78 | -0.08 |
| 6 | 2.70 | 10ft | 1.61 | +0.09 |
| Total SG = | +0.85 |
So through the 6 shots from 60yds Edoardo’s strokes gained score was +0.85, he was nearly a shot better than the PGA Tour Average from this yardage over 6 shots. His TC score for this group was 82.8, and the average hit was 9.8ft from the hole.We can see the scores correlate nicely, as the average from 60 yards on Tour is just less than 13ft. Edoardo hit it closer than that in 5 of the 6 shots and gained on all of those shots, he also scored well on the TC.
From 70yds he scored +1.27 SG and his combine score was 84.8. Both scores were higher compared to the 60yard shot and the average hit was 10.1ft from the hole. From 70 yards the PGA average distance to the hole is 14ft, Edoardo was 3.9ft better than average.
From 60yds he only beat the average by 3.2ft. This is why he scored better on both SG and the TrackMan Score.
Table 3
| 70 Yds | SG Start | Hit To | SG To Hole Out | Strokes Gained Score |
| 1 | 2.73 | 3ft | 1.04 | +0.69 |
| 2 | 2.73 | 8ft | 1.50 | +0.23 |
| 3 | 2.73 | 22ft | 1.89 | -0.16 |
| 4 | 2.73 | 7ft | 1.42 | +0.31 |
| 5 | 2.73 | 10ft | 1.61 | +0.12 |
| 6 | 2.73 | 11ft | 1.65 | +0.08 |
| Total SG = | +1.27 |
See below the rest of Edoardo’s entire test using Strokes Gained to analyse the shots;
Table 4
| 80 Yds | SG Start | Hit To | SG To Hole Out | Strokes Gained Score |
| 1 | 2.75 | 6ft | 1.34 | +0.41 |
| 2 | 2.75 | 6ft | 1.34 | +0.41 |
| 3 | 2.75 | 2ft | 1.01 | +0.74 |
| 4 | 2.75 | 18ft | 1.83 | -0.08 |
| 5 | 2.75 | 13ft | 1.71 | +0.04 |
| 6 | 2.75 | 2ft | 1.01 | +0.74 |
| Total SG = | +2.26 |
Table 5
| 90 Yds | SG Start | Hit To | SG To Hole Out | Strokes Gained Score |
| 1 | 2.78 | 8ft | 1.50 | +0.28 |
| 2 | 2.73 | 10ft | 1.61 | +0.17 |
| 3 | 2.78 | 12ft | 1.68 | +0.10 |
| 4 | 2.78 | 15ft | 1.78 | 0.0 |
| 5 | 2.78 | 11ft | 1.65 | +0.13 |
| 6 | 2.78 | 4ft | 1.13 | +0.65 |
| Total SG = | +1.33 |
Table 6
| 100 Yds | SG Start | Hit To | SG To Hole Out | Strokes Gained Score |
| 1 | 2.80 | 14ft | 1.74 | +0.06 |
| 2 | 2.80 | 1ft | 1.00 | +0.80 |
| 3 | 2.80 | 10ft | 1.61 | +0.19 |
| 4 | 2.80 | 1ft | 1.00 | +0.80 |
| 5 | 2.80 | 8ft | 1.50 | +0.30 |
| 6 | 2.80 | 14ft | 1.74 | +0.06 |
| Total SG = | +2.21 |
Table 7
| 120 Yds | SG Start | Hit To | SG To Hole Out | Strokes Gained Score |
| 1 | 2.85 | 11ft | 1.65 | +0.20 |
| 2 | 2.85 | 19ft | 1.85 | 0.0 |
| 3 | 2.85 | 13ft | 1.71 | +0.14 |
| 4 | 2.85 | 17ft | 1.82 | +0.03 |
| 5 | 2.85 | 18ft | 1.83 | +0.02 |
| 6 | 2.85 | 7ft | 1.42 | +0.43 |
| Total SG = | +0.82 |
Table 8
| 140 Yds | SG Start | Hit To | SG To Hole Out | Strokes Gained Score |
| 1 | 2.91 | 36ft | 2.03 | -0.12 |
| 2 | 2.91 | 17ft | 1.82 | +0.09 |
| 3 | 2.91 | 10ft | 1.61 | +0.30 |
| 4 | 2.91 | 11ft | 1.65 | +0.26 |
| 5 | 2.91 | 11ft | 1.65 | +0.26 |
| 6 | 2.91 | 2ft | 1.01 | +0.90 |
| Total SG = | +1.69 |
Table 9
| 160 Yds | SG Start | Hit To | SG To Hole Out | Strokes Gained Score |
| 1 | 2.98 | 8ft | 1.50 | +0.38 |
| 2 | 2.98 | 16ft | 1.80 | +0.18 |
| 3 | 2.98 | 14ft | 1.74 | +0.24 |
| 4 | 2.98 | 14ft | 1.74 | +0.24 |
| 5 | 2.98 | 11ft | 1.65 | +0.33 |
| 6 | 2.98 | 12ft | 1.68 | +0.30 |
| Total SG = | +1.67 |
Table 10
| 180 Yds | SG Start | Hit To | SG To Hole Out | Strokes Gained Score |
| 1 | 3.08 | 8ft | 1.50 | +0.58 |
| 2 | 3.08 | 9ft | 1.56 | +0.52 |
| 3 | 3.08 | 9ft | 1.56 | +0.52 |
| 4 | 3.08 | 32ft | 2.00 | +0.08 |
| 5 | 3.08 | 14ft | 1.74 | +0.34 |
| 6 | 3.08 | 29ft | 1.97 | +0.11 |
| Total SG = | +2.15 |
Table 11
| Combine Score | Strokes Gained Score Added | |
| 60yds | 82.8 | +0.85 |
| 70yds | 84.8 | +1.27 |
| 80yds | 91.1 | +2.26 |
| 90yds | 89.8 | +1.33 |
| 100yds | 93.1 | +2.19 |
| 120yds | 88.6 | +0.82 |
| 140yds | 90.0 | +1.69 |
| 160yds | 94.0 | +1.67 |
| 180yds | 91.8 | +2.15 |
| Total | 89.5 | +14.23 |
+14.23 shots.. So far!!!
So Edoardo’s scored +14.23 SG for the shots required to complete the iron part of the TC, all 54 of them. His best distance was from 80yds, here he scored +2.26 shots on the PGA Tour average.
His weakest distance was 120yds, he still scored +0.82 compared the PGA Tour average from this range but this was his lowest scoring yardage. This really shows the quality of the shots that Edoardo has hit, they have not been compared to any old shots, they have been compared to shots from the very best players in the world, and he scored +14.23 SG better.
So what are the differences between on course data and TC data? With shots of this quality, you may wonder why Edoardo is not the world number 1 by a mile, or was this test just a fluke? Alternatively are there any underlying reasons why Edoardo’s SG results so high? I think there are a few factors to take into consideration when trying to answer these questions:
1 – Multiple Shots at 1 Yardage
In the TC you hit 6 shots, 3 consecutive shots twice, at each distance. After shot 1 at 60yds you get instant feedback on how long or short, left or right you have hit it from the pin. Your second shot is again at 60yds and you can adjust from the previous shot, again the third shot is 60yds so by this point you are more dialed into that distance than you ever get to be on the golf course.
On the course a successful shot normaly entails you moving the ball closer to the hole from where you start, so having 2 shots the same length in a row seldom happens. This is one reason Edoardo’s score is so high, the added benefit of being able to dial in shots is unquantifiable but definitely has some impact on the results.
2 – Pressure / Nerves in Tournament Golf vs On Range Practice
SG averages are all taken from ShotLink data captured in PGA Tour events. Pressure is not taken into consideration when the data is formulated from the Tour. The stats are miss or make whether it’s a 10ft putt on the second hole on a Thursday, a 10ft putt on the 18th hole Friday to make the cut or a 10ft putt on the 18th hole Sunday to win the tournament and a million dollars.
The pressure of the moment is never taken into account. Even though there is a feeling of pressure when a high TC test score is being developed, it is probably not the same level of pressure to win a tournament or keep your playing rights for another year. Again it’s hard to answer the amount this influences the results but I believe it definitely has some effect.
3 – Where is the players “REAL Target” on the Course
I believe this to be the biggest influence as to why Edoardo’s score is so surprisingly high. In the TC the target is very simple, when aiming for the 60yrd target, hit it 60yds on the target line, when aiming for 180yrd target, hit it 180yds on the target line. That is the extent of the players thought process. When on the golf course, players take-in many different variables that effect the target where they actually want to hit the ball.
Augusta National is the best example of this, on the famous Par 3 12th hole the Sunday pin position is always way on the right side of the green hanging by the slope to Rae’s Creek. Because of the danger surrounding this flag position, and the difficulty of hitting that small corner of green players tend to aim for the safer part of the green 15ft left of the pin. So in this example their target is not the pin, its 15ft left and pin high.
They could therefore hit the perfect shot and land their ball precisely where they wanted to, but their on course stats will show that they have hit 15ft left of the pin position so they have missed the target by 15ft. This multiplied many times during the course of a round I believe is the main reason that all on course stats will always look worse than TC results. It is impossible at the moment to find out the real target that players are aiming for on the golf course, this will always cause the lack of compatibility between on course and practice ground statistics.
Analyzing Driving using the Strokes Gained Formula

Edoardo Molinari, of Italy, watches his shot from the 18th tee during completion of the final round of the Arnold Palmer Invitational golf tournament at Bay Hill in Orlando, Fla., Monday, March 29, 2010. (AP Photo/John Raoux)
To calculate Driving using the SG formula is slightly more problematic than with the iron shots. This is because of the equation that SG uses as mentioned earlier, in order to calculate the shots gained formula you need:
- The “Starting Distance from the Hole”
- The “Lie of the Ball”
- The “Finishing Length from the Hole”
You may be able to see the problem.. When you hit a driver in the combine test, the data given to you by the test is “Total Distance” and “Deviation” from the target line. So we do not have the starting distance from the hole nor the finishing length from the hole, 2 pieces of information that are essential. The 1 piece of information that is available is the lie, we can presume all drives will be taken from a tee. So how can we find out these 2 pieces of essential data needed to complete the test and therefore be able to analyse Edoardo’s game in the same way from 60 yard pitch to the driver.
The answer is actually quite simple, to achieve starting distance and finishing length to the hole all you have to do is to imagine Edoardo is actually playing a hole. If we imagine he is playing an average par 4 of 400 yards we now know the length of our imaginary Par 4 so we get the first part of our SG formula “1. The Starting Distance”. Then if we use Edoardo’s first drive from the combine and it goes 291 yards, now we know “3. The finishing length from the hole” in this example he has 109 yards left to the green.
The Process of Finding the Perfect Length Par 4 for this Test
The actual specifics of the hole that all of Edoardo’s drives will be calculated against is important. The length of the hole has been chosen to make the data as easy to understand as possible. Firstly as SG is a concept based wholly around tour average, a good starting point to working out the perfect length hole would be “What is the PGA Tour Average length drive?” The answer was 289 yards in 2012, the last year of statistics in the book Every Shot Counts.
The next step was working out, “What is the distance that it takes an average of 3.00 shots to hole out from” and therefor making par? That answer is 165 yards, from 165 yards the PGA tour average is 3.00 shots to hole out. So if Edoardo was to hit an average length drive of 289 and had 165 yards to the pin, it should take him 3 more shots on average to make his par. Adding 289 yards and 165 yards gives us a par 4 length of 454 yards which means if you tee off from a hole that is 454 yards and you hit a PGA Tour Average length drive you will leave your self 165 yards or 3.00 shots to get you par.
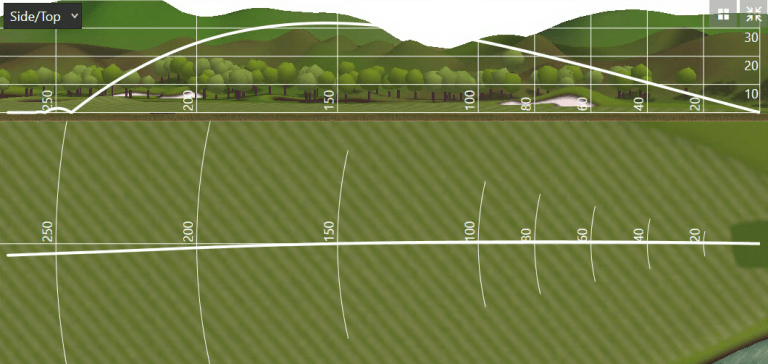
The average PGA Tour fairway width is a very hard figure to find, but excluding majors where fairway width is considerably less, 26 yards wide is an average size with the first cut a further 5 yards either side and then second cut another 5 yards after that. The final look of our imaginary TC driving hole can now been seen in image 1. Below you can see all 6 of Edoardo’s drives that he hit in the TC and where they finished in the virtual hole. With the target line plum in the middle of the fairway, Edoardo’s biggest miss was only 12.6 yards left of target line (drive 4), this meant all of his drives hit the fairway.
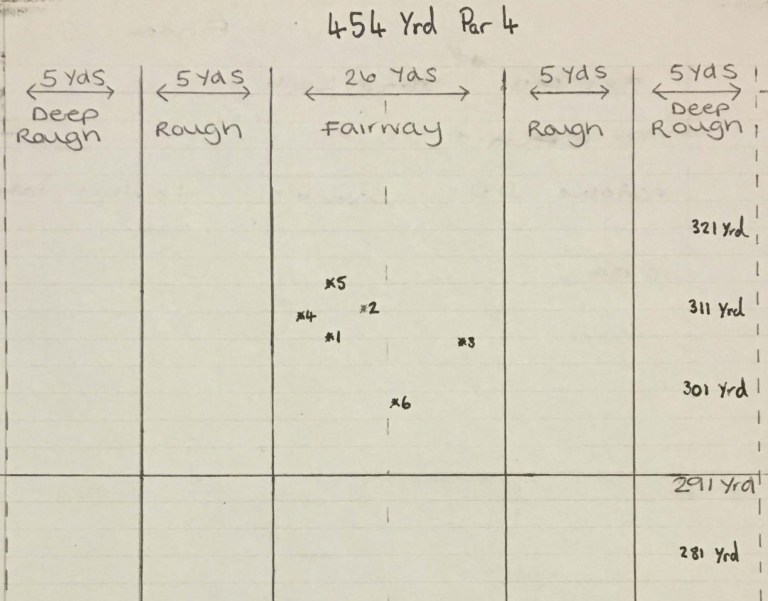
Table 12
| Driver | SG Start | Total Distance | Deviation from Target | To Hole | Lie | SG To Hole Out | SG Score |
| 1 | 4.15 | 303yds | 8.2 Yards Left | 151yds | Fairway | 2.95 | +0.2 |
| 2 | 4.15 | 311yds | 4.2 Yards Left | 143yds | Fairway | 2.92 | +0.23 |
| 3 | 4.15 | 301yds | 11.3 Yards Right | 153yds | Fairway | 2.95 | +0.2 |
| 4 | 4.15 | 306yds | 12.6 Yards Left | 148yds | Fairway | 2.94 | +0.21 |
| 5 | 4.15 | 314yds | 7.5 Yards Left | 140yds | Fairway | 2.91 | +0.24 |
| 6 | 4.15 | 297yds | 0.5 Yards Right | 157yds | Fairway | 2.97 | +0.18 |
| Total SG = | +1.26 |
Drive 1 SG Formula
| 4.15Start Position | – | 2.95Left to hole | – | 1Shot Taken | = | +0.2Strokes Gained |
So out of the 6 drives he hit, Edoardo’s SG score was +1.26. He hit all of his drives longer than the Tour average and he managed to hit the fairway with every shot.
How TrackMan Combine Normally Measures Drives
The TrackMan Combine uses a very simple formula for measuring its driving score. The maximum score is 100 and this is based on the distance and the accuracy of the shot.
If 2 drives finish on the target line but 1 drives goes 200 yards and the other goes 250 yards then the longer drive will score higher.
In the same way if 2 drives both go 250 yards and the first is 10 feet left of the target line and the second is 20 feet from the target line then the first drive will score higher. This can be seen in an example from a TC completed by Stephan Tiley where he scored a fantastic 92.0 and had the world record for best combine at the end of 2013. Below you can see 3 of his drives from that test.
Table 13
| Shot No. | Score | Carry (yds) | Side (ft) |
| 2 | 92 | 243.7 | 12.4L |
| 5 | 89 | 242.0 | 19.0L |
| 6 | 66 | 244.3 | 47.5L |
From looking at the 3 shots that Stephan hit we can clearly see that their distances were all very similar, with only 2.3 yards separating them. However the scores are very different. Shots 2 and 5 scored roughly the same, though shot 6 was the longest of the 3 drives it scored only 66 because it was 47 feet left of the target line. This shows that driving is scored on a bi axel basis with distance and accuracy both being taken into account to create the score.
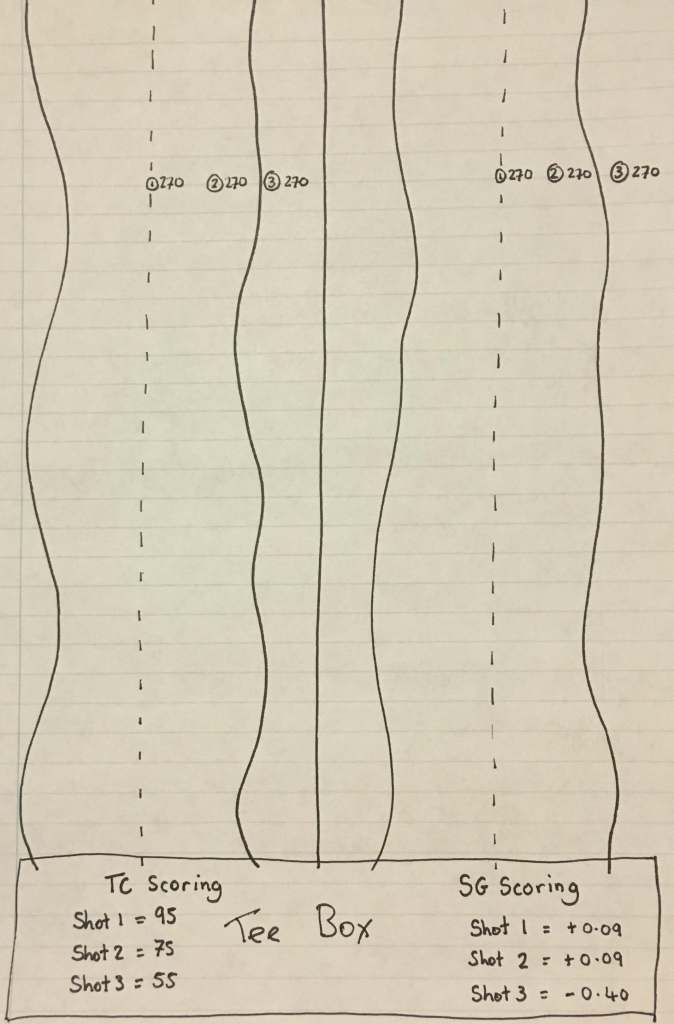
By using the SG to analyse the drives it forces us to look at the scores slightly differently. SG evaluates if you have hit the fairway or not, and how far your shot has traveled. If you hit 2 drives that go exactly the same distance and they both finish in the fairway then they are judged as scoring the same, regardless if 1 lands plum in the middle of the fairway and the other finishes left edge of the fairway. This is clear to see when you look at Table 12, shots 1 and 3, in Edoardo’s results, the two drives go a lengthy 303 and 301 yards off the tee and both hit the fairway.
The SG for the 2 drives are the same, both score +0.20, but when you look at their deviation from the target line there is considerable difference. Shot 1 is 8.1 yards left of the target line and shot 3 is 11.3
yards right of the target line, nearly 50% more deviation yet the both score the same SG figure. This may seem strange as 1 drive was clearly better than the other, but in reality when you hit a
ball down the fairway it has no added value if it is in the centre of the fairway or the left or right side of the fairway (forgetting where the pin is located).
The only disadvantage comes when you miss the fairway and your ball comes to rest in the first cut or second cut of rough, or worse. This difference in scoring can be seen in the example in image 2.
Analysis of the Results
In table 14 you can see the end result of Edoardo’s TC and SG scores. So scoring 90.0 on the TC resulted in a total SG result of +15.4 shots better than tour average for the 60 shots he hit. This is a surprising large figure but it really shows the quality of the shots that were hit in order to score in the 90’s in the TC.
- Total SG for all iron shots +14.23
- Driving SG +1.26
- Total SG +15.4
- His combine score was 90.0 out of 100
Table 14
| Combine Score | SG Score Added | |
| 60yds | 82.8 | +0.85 |
| 70yds | 84.8 | +1.27 |
| 80yds | 91.1 | +2.26 |
| 90yds | 89.8 | +1.33 |
| 100yds | 93.1 | +2.19 |
| 120yds | 88.6 | +0.82 |
| 160yds | 94.0 | +1.67 |
| 180yds | 91.8 | +2.15 |
| Driver | 94.5 | +1.26 |
| Total | 90.0 | +15.4 |
We can see his highest scoring distance was 80 yards and his lowest scoring was 120 yards by a difference of 1.44 shots. Interestingly the combine score worked out his highest scoring yardage was 160 yards and he lowest scoring yardage was 60 yards. This difference is very easily
explained and is a result of the differing formulas used by TC and SG to work out the score each shot is given.


The graphs above where created from the data used from Stephan Tiley’s combine world record back in 2013 (see below in table 15). I selected his 6 shots at the 180 yards target as it gave the best spread of shots. As you can see in the SG graph, you score more heavily the closer you hit it, this causes the concave looking line whereas in the TC graph the line is more linear. A shot hit to 1ft will gain a bigger percentage SG than a shot hit to 8ft, in graph B you can see that the increases are not incremental. In the Combine scoring system you can see the score and distance to the pin increases his resulting score equally with the closer you hit it the more you score. This can be seen in graph A.
Table 15
| Shot | SG Start | Distance Hit to Pin | SG to Hole Out | SG Score | TrackMan Score |
| 1 | 3.08 | 6ft | 1.34 | +0.74 | 100 |
| 2 | 3.08 | 25ft | 1.93 | +0.15 | 86 |
| 3 | 3.08 | 20ft | 1.87 | +0.21 | 89 |
| 4 | 3.08 | 27ft | 1.95 | +0.13 | 84 |
| 5 | 3.08 | 16ft | 1.80 | +0.28 | 93 |
| 6 | 3.08 | 4ft | 1.13 | +0.95 | 100 |
| *7 | 3.08 | 10ft | 1.61 | +0.48 |
* In the SG graph I added in 1 extra point at 10ft. This was because of the large gap between the second closest shot, 6ft and 3rd closest shot, 16ft. More data points would make the graph more accurate on both graphs however too few points on a non linear graph could compromise the shape of the graph. For a linear graph you could only have two points and it would still resemble the correct result.
So How Good is a TC Score of 90?
There is no doubt to the quality of Edoardo’s golf during this test. He currently sits 20th on the all time TC leaderboard with a score of 90.1 (he has beat his score of 90.0 which the data of this report was made from). As a coach it is clear to see his weakest distance was 120yds and this is the area he should focus his practice time on. As a player (who cannot score anywhere near 90) I am completely in awe of how good the consistency of the shots were to achieve the score.
To bring conclusion to the question I set out to answer, to score 90 or above in a TC you need to hit it around 15 shots better that the PGA Tour average over the course of the test. Thats an average of +0.25 better than the Tour average with every shot. This level of golf and specifically Edoardo’s golf during this test is outstanding.
Adopting this Approach to the TrackMan Combine Test
I really do think that TC is a great test in its current format, it gives good feedback and is one of the best ways to simulate pressure in a practice environment. It is obviously well loved around the globe with many thousands of tests being performed yearly. The fact the best players in the world use it and post their scores online for the world to see is a great sign that TrackMan has created a practice tool that Tour players value and respect.
Analyzing TC using SG adds an interesting layer of information to anyone interested in improving their game. It works for all levels of golfers from Tour players and elite amateurs that score in the 80s and 90s and club golfers scoring in the 40s and 50s, and helps put a figure on how many shots actually separates a players strengths from their weaknesses.
There are some obvious ways in which it is not a true reflection to on course statistics. The main three I have explained earlier. This does not mean that TC is not relevant to real golf, quite the opposite in fact, there is definitely a feeling of pressure whilst the test is being taken. I have spoke to pros and amateurs and there is wide agreement that when you have a good score going on the TC there is an on course style feeling of pressure that builds during the test as you develop a good score through good shots.
In fact listening to the story of how Daniel Gavins scored the current world record TC score of 93, his coach Mark Pearson described how he was hiding under the desk as he was hitting the last few shots as all present knew the score that he was heading for and the pressure was astonishing. He even hit 2 poor drives to finish the test and may have scored 95 had those 2 drives been as good as his previous 4 drives.
So the feeling of pressure is what carries over fantastically well from the real golf environment to the TC. My feeling from the results are it is impossible at the present moment to replicate the exact stress’s and emotions found on the golf course into a practice environment. However I do believe the TC has got the closest of any practice tool I have ever come across. SG and TC I think are a match made in heaven and help to reveal the score’s real value at the end of the test.